
FlowOps360™ Resource
Simple GTM Metrics Dashboard
A clarity-first dashboard to validate whether the numbers you track actually explain growth — not just activity.
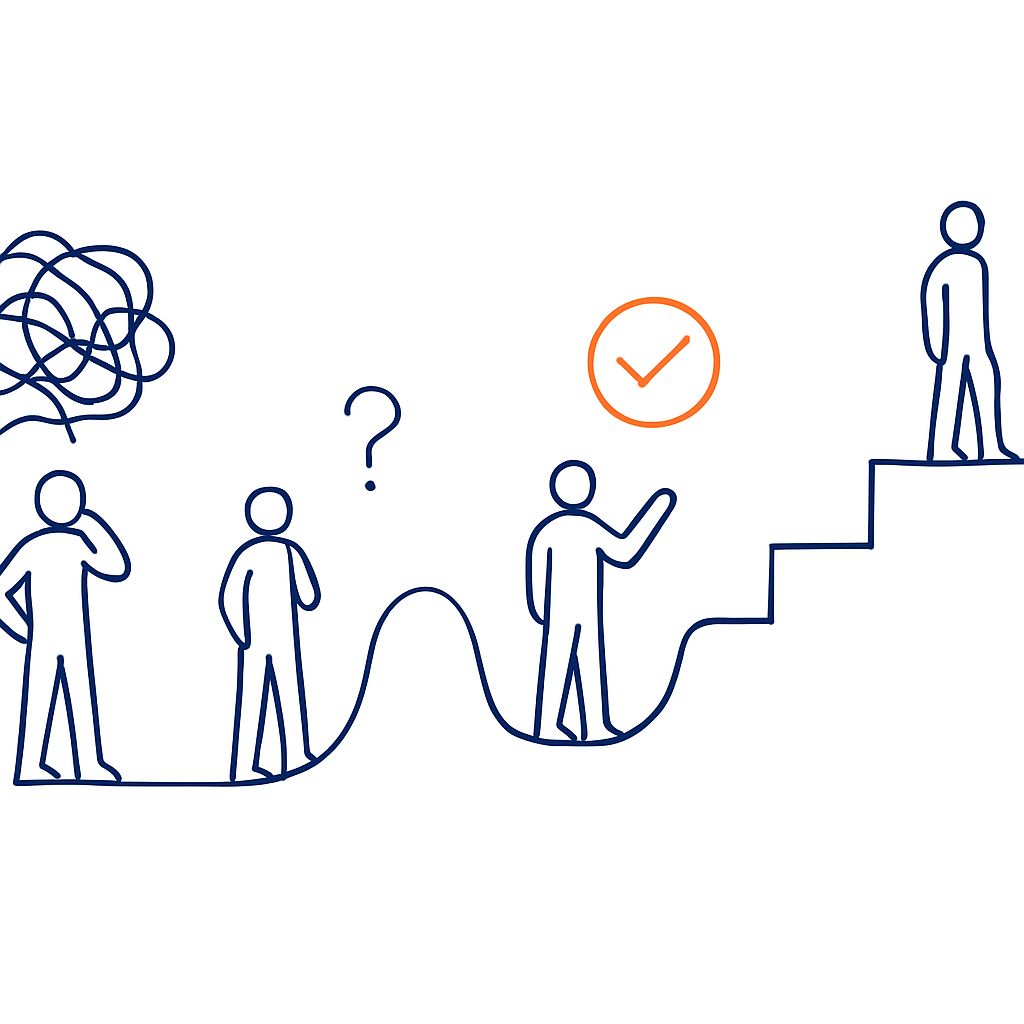
Most leadership teams believe they are data-driven because they track CAC, revenue, and churn. When decisions stall or growth feels fragile, the issue is rarely missing data. It’s that teams track too many metrics, calculate them differently, or review dashboards that explain what happened rather than what to do next. This dashboard exists to prevent collecting metrics for reporting comfort instead of decision clarity.
Who This Resource Is For
- B2B Service & SaaS Companies: Seeking alignment on growth signals.
- Founders & Operators: Responsible for strategic growth decisions.
- Fractional CFOs: Supporting leadership teams with financial clarity.
- Teams: Tired of debating opinions instead of verifiable signals.
This is a decision-alignment tool, not a reporting dashboard.
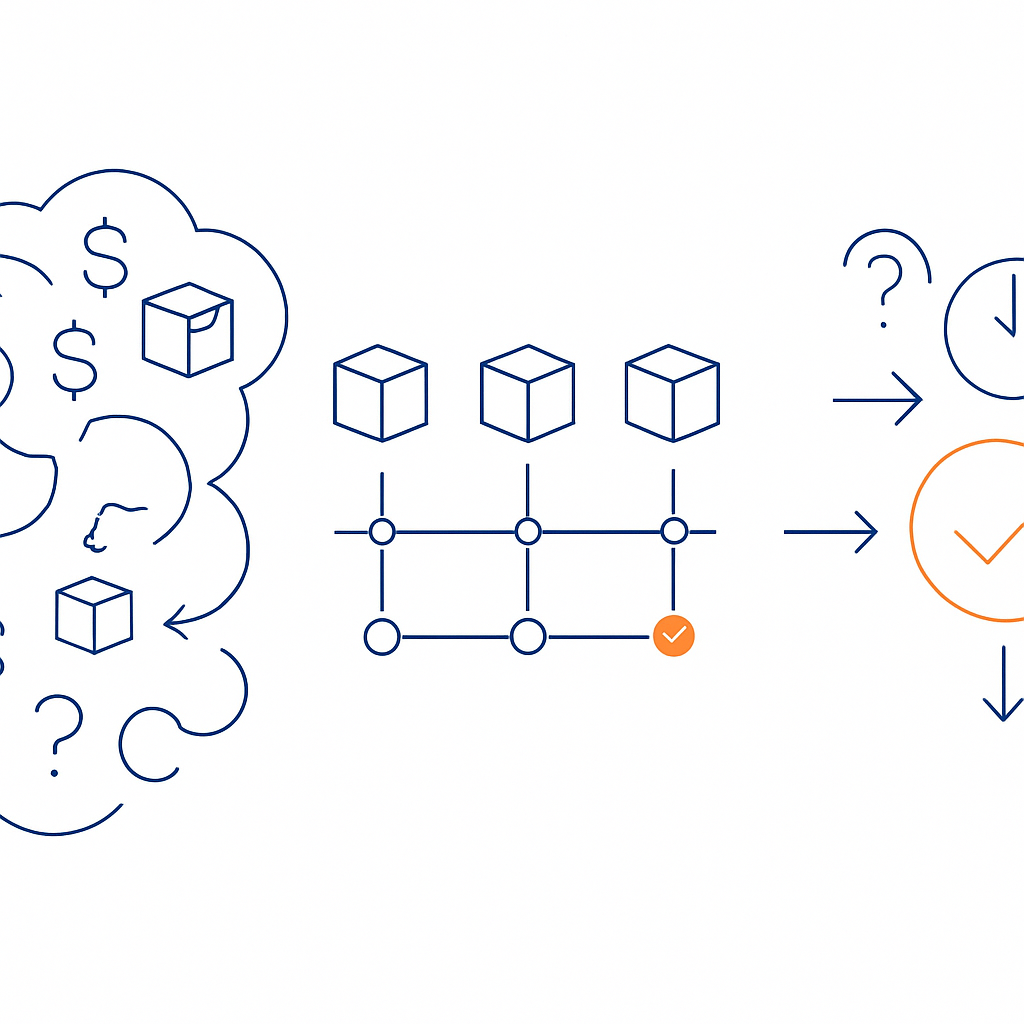
How the Dashboard Works
1. Filter Metrics
Every metric must answer a clear “so what?” question or it is removed.
2. Prioritize View
A single page forces leadership to internalize the same growth story.
3. Monthly Cadence
Strategic signals are reviewed monthly, not monitored daily.
4. Suggest Decisions
Each metric must point toward a possible decision or adjustment.
Example: Fictional Fractional CFO Client
A 20-person B2B services firm experiencing growth without confidence.
| Metric | Signal Revealed |
|---|---|
| CAC | Increased 30% over six months. |
| LTV:CAC | Declined as lifetime value remained flat. |
| Revenue Growth | Slowed while churn increased quarter over quarter. |
Leadership paused channel expansion and focused on positioning and onboarding clarity, restoring confidence within two quarters.
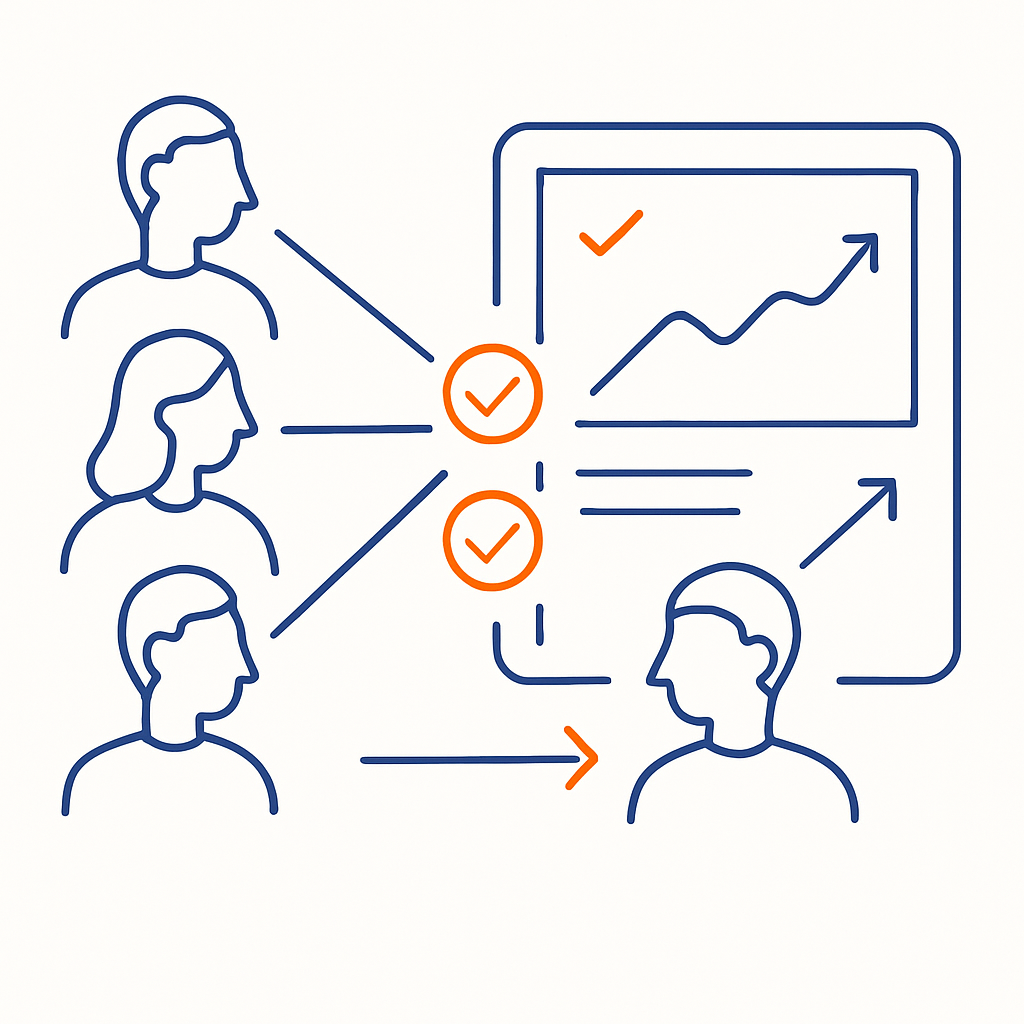
What the Output Means
The dashboard highlights decision signals, not just calculations.
- Rising CAC: Indicates messaging, targeting, or channel efficiency issues.
- Flat LTV: Suggests delivery or value-perception problems.
- LTV:CAC Below 3:1: Signals fragile growth requiring intervention.
If leaders don’t agree on definitions or interpretation, insights remain directional, not decisive.
Stop Tracking for Comfort. Start Acting with Intent.
Metrics should reduce debate, not create it.